Looking behind the maps with Prof Keith Lilley, Queen’s University Belfast
The earliest and most detailed mapping of Ireland’s townlands is now nearly two hundred years old. In 1824, the Ordnance Survey began its work creating a new series of maps covering the whole island at the large scale of six-inches to one-mile. This was an ambitious undertaking, and Ireland was the first country in the world to be entirely mapped at this scale.
Looking at the Ordnance Survey 6” maps of Ireland offers us a snapshot of the landscape as it was just before the arrival of the railways. The surveyors were interested in ensuring their maps were as accurate as possible, and especially for determining the boundaries of the ancient townlands. This was in fact the main purpose of the survey, to help reevaluate the taxes levied through the size of each townland, so accuracy in measurement in the field was important.
Out ‘in the field’, the surveyors journeyed across the whole of Ireland, from north to south, over a period of thirteen years, between 1829 and 1842. The final 6” maps were published in 1846. The surveyors’ trace across the Irish landscape is also plotted out by the maps they helped to create. Each 6” map sheet has on its margins information on those men who surveyed the ground, and then engraved the map for printing. This gives each map its own ‘biography’ and links the map itself back into the field where its features were surveyed in such detail and with such accuracy.
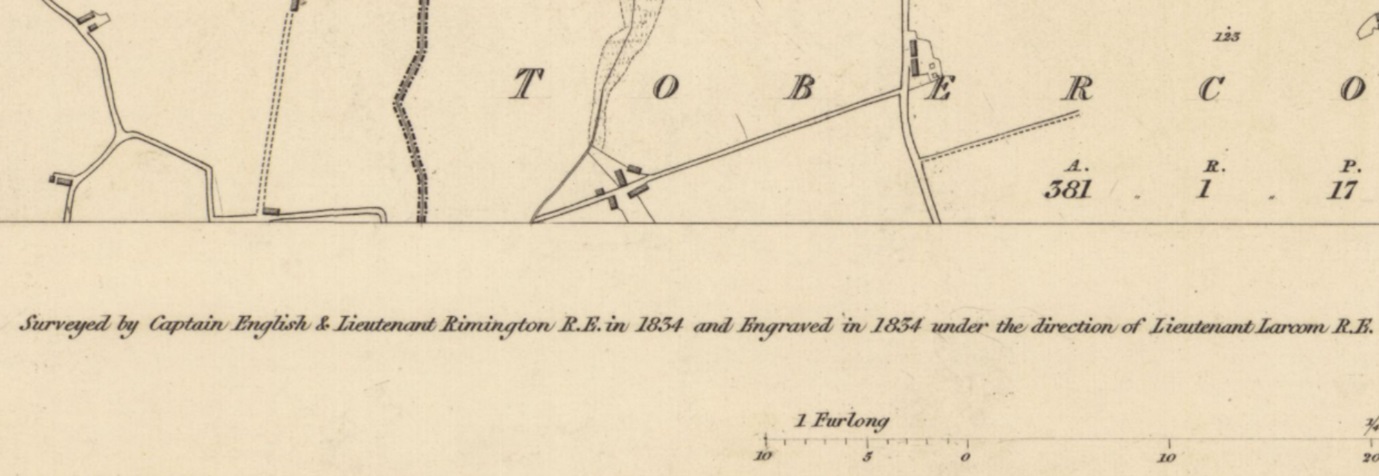
Marginal information on County Down sheet 37, naming the surveyors as Captain English and Lieutenant Rimington (Royal Engineers). ‘A.R.P.’ written underneath the townland name (Tobercorran) indicates the calculated townland area (in acres, roods, perches). Surveyed: 1834, engraved: 1834, printed: 1837. Size: map 61 x 92 cm (ca. 24 x 36 inches), on sheet ca. 70 x 100 cm (28 x 40 inches). Reproduced with the permission of the National Library of Scotland (https://maps.nls.uk/view/246835403)
A close look at the 6” OS map shows a range of landscape features, from roads and settlements, to rivers, loughs, buildings, woodland and parkland. They are a sight to behold, beautiful to look at, so carefully executed with the engravers work reflected in the carefully drawn lines and the neat writing, all there to see on the finished map. While of course there are still controversies about the forms of the place-names that appear on the map, the 6” maps themselves ‘tidy up’ the Irish landscape, for all maps are selective, and partial, in what they show.
There is one special characteristic feature too of the first edition series of the OS 6” maps of Ireland. A distinctive trait is a trail of dots, organised in straight lines, criss-crossing the map. These dots on the map represent the trails through the landscape taken by the OS surveyors in the field. They are called ‘chaining lines’ and a close look at the map shows these lines radiate out from ‘trigonometrical stations’. One of the first tasks of the OS surveyors in the field was to create a series of triangles across the landscape, a ‘trigonometrical network’. Each triangle was measured in the field by an accurate and precise instrument, a theodolite, and on the 6” map a triangle symbol with a dot is used to show where the theodolite was set up by the surveyors.
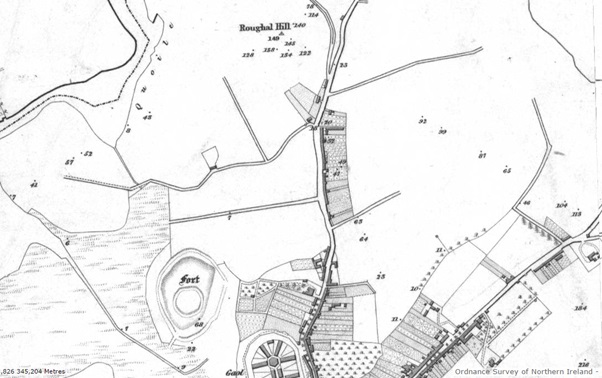
Looking across the 6” map we can see numerous trigonometrical stations shown, each a reminder of where the surveyors stood in the landscape to make their observations. About a century after the survey, one of the director generals of the OS, Sir Charles Close, reflected on this arduous task, writing “From trig point to trig point the chain was dragged….”. The field operations of the OS that underpinned the 6” maps were indeed hugely laborious. The surveying equipment had to be manhandled across bog, mountain, and pasture, across the landscape. Those dots on the map—the chaining lines—show where the surveyors trudged, joining up their trigonometrical stations with measurements of heights and distances, to show on the maps the rise and fall of the land, to give a sense of relief. Contours on OS maps came later.
So now, two hundred years later, when we look at the first edition of the 6” OS maps, we should try to see ‘behind the map’, to the field. It was in the field the maps were made, wrought from the landscape by specially trained military men, commanded by Thomas Colby. The trigonometrical stations and chaining lines on the maps stand as testimony to this huge endeavour, made all the more poignant this year—in 2024—the bicentenary of the start of the Irish Ordnance Survey.
Prof Keith Lilley, Queen’s University Belfast